


Introduction
Heart disease is a leading cause of death worldwide, with an estimated 17.9 million deaths each year. As a data scientist, I understand the challenges of early detection and diagnosis, especially given the complex and multifactorial nature of the disease. In recent years, I have explored machine learning as a promising approach for predicting and identifying risk factors associated with heart disease. In this article, I present a case study using the Autogluon library to develop machine-learning models for heart disease prediction and discuss the implications and future applications of the project results.
Tools
Python programming language
Jupyter Notebook as the development environment
AWS Sagemaker Autopilot
Pandas for data manipulation
Numpy for numerical operations
Seaborn and Matplotlib for data visualization
Scikit-learn for evaluation metrics
Uses
Some possible uses of this model could be
Physicians and healthcare professionals can use these models to predict the likelihood of heart disease in patients based on their age, weight, gender, lifestyle choices, blood pressure, cholesterol, and glucose levels.
Patients can also use these models to assess their risk of heart disease and make necessary lifestyle changes to prevent or manage the disease.
Healthcare organizations and policymakers can use these models to identify risk factors and develop targeted prevention and treatment strategies for heart disease.
Overall, the trained models have the potential to contribute to better patient outcomes and improved public health by providing accurate predictions and insights related to heart disease.
Data
Input:
Age, Height weight, Gender,
Smoking, Alcohol intake, Physical activity
systolic blood pressure, Diastolic blood pressure
Cholesterol, Glucosee
All this data is meant to produce a binary output (0 or 1) showing if the patient either has heart disease or not
The dataset uses can be found here
Setup
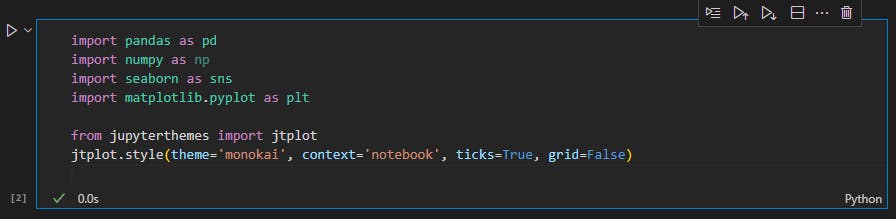
The first step was to set up my work environment and make sure I had all the resources and libraries I needed for the project. So I started by installing the following modules using pip: autogluon, pandas, numpy, seaborn and matplotlib.pyplot, then imported the following libraries and changed the theme of my jupyter notebook to make the data easier to visualize
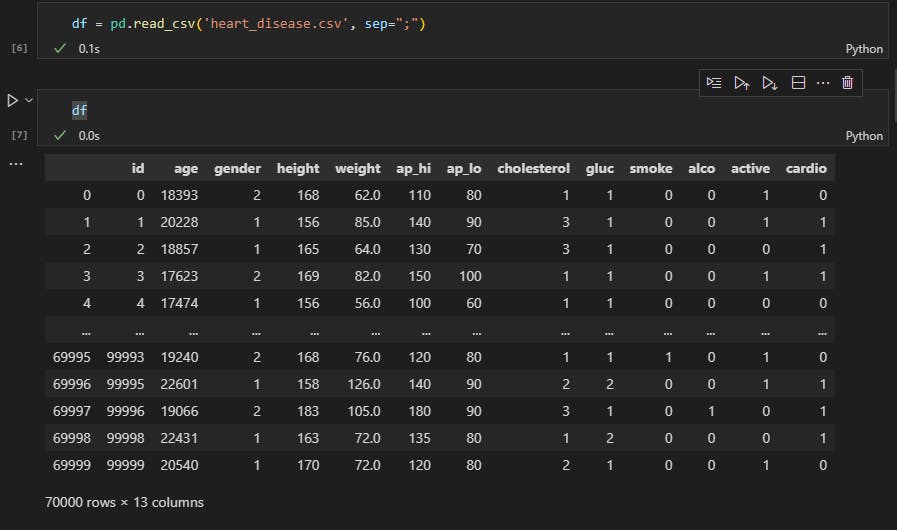
Then I read the disease data using pandas
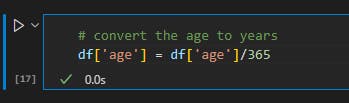
the age is currently being counted in days so I converted it using and removed the id column
Visualization
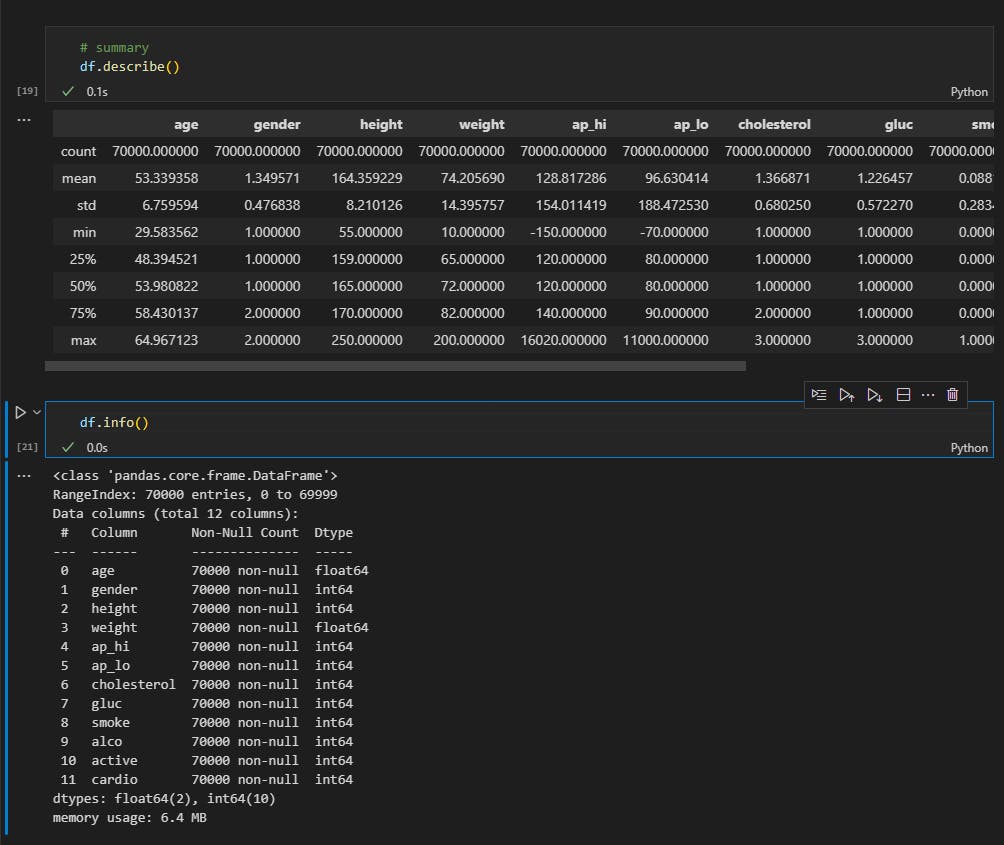
For this part first I checked the data summary to make sure there were no null values in the data.
Here I used some data visualization tools to analyze the data
Histogram:
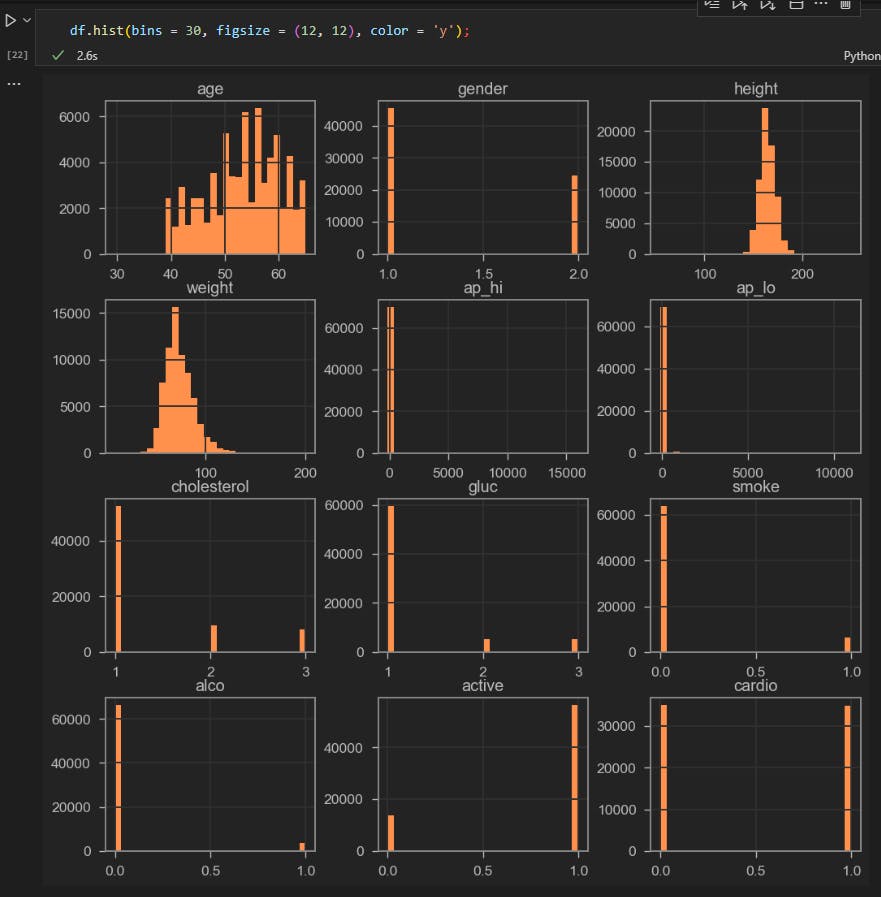
from this, I can tell that there are not a lot of smokers in the data set and even fewer drinkers
Then I created a correlation matrix to show how the data relates to itself
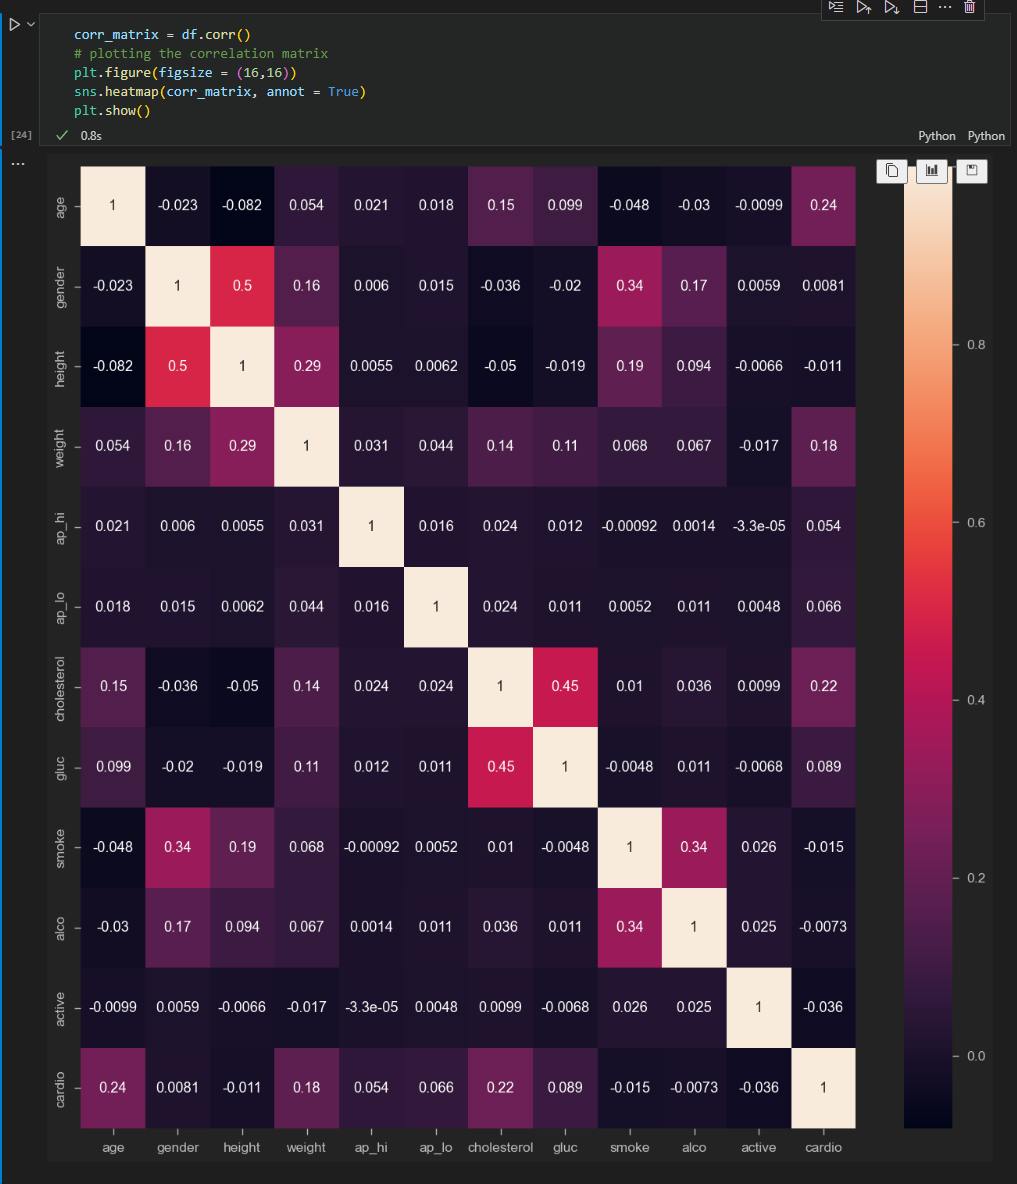
The diagonals 1's are there because the age column correlates perfectly with itself. From this, we can tell there is some correlation between height and gender and also between glucose and cholesterol
Training
Before I started training my model I first split the data into 2 parts, I randomly set aside 20% of the data for testing and left the remaining 80% for testing, like so;
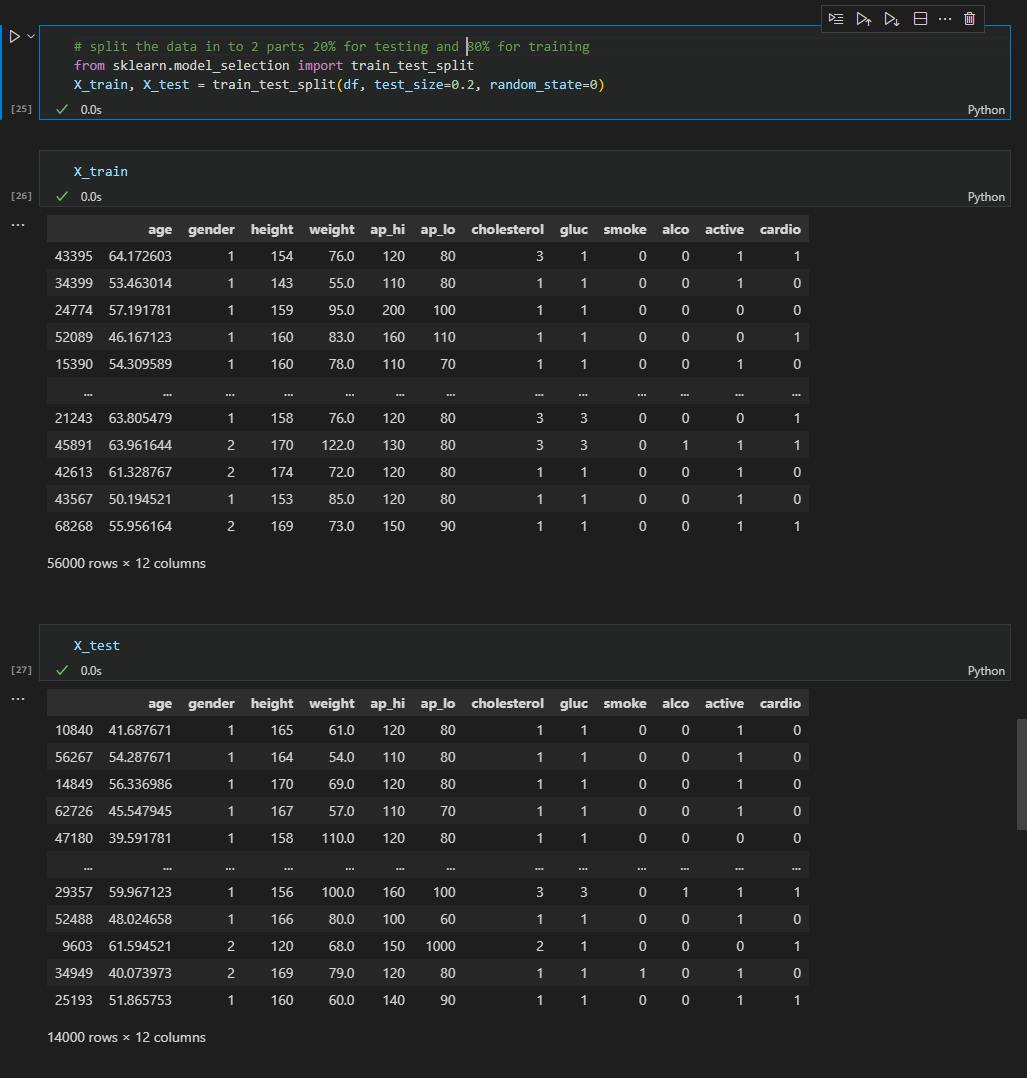
You can see the order has been shuffled, this is important as we do not want the model to learn the order of the data
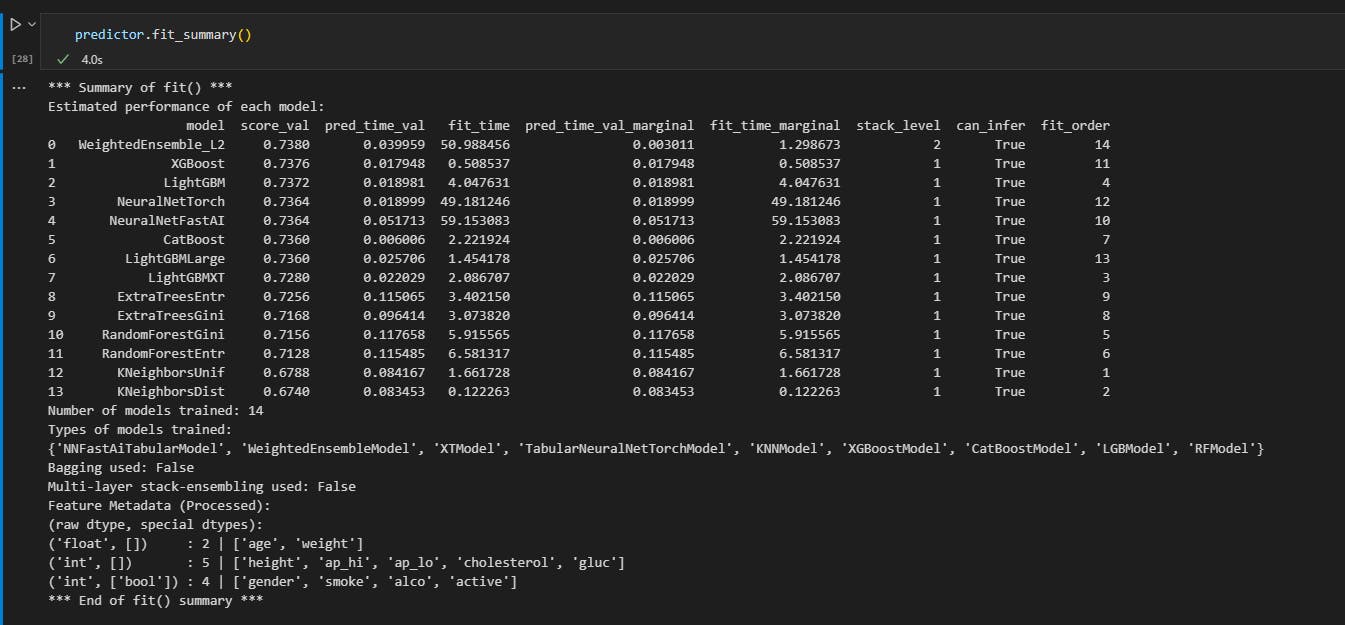
Then I trained the model, I set the training quality to medium which is the default, I set the output to cardio and the problem_type to binary
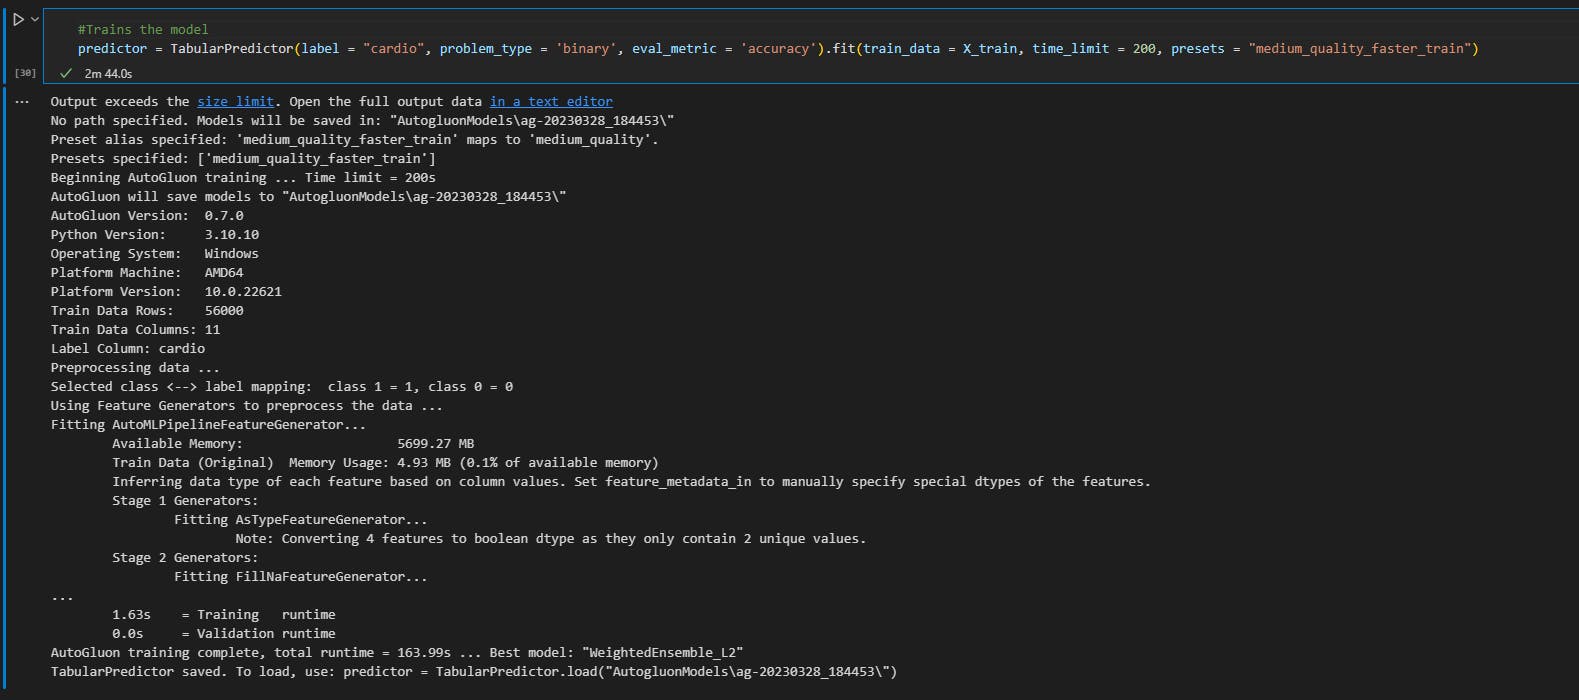
here is a summary of the models trained
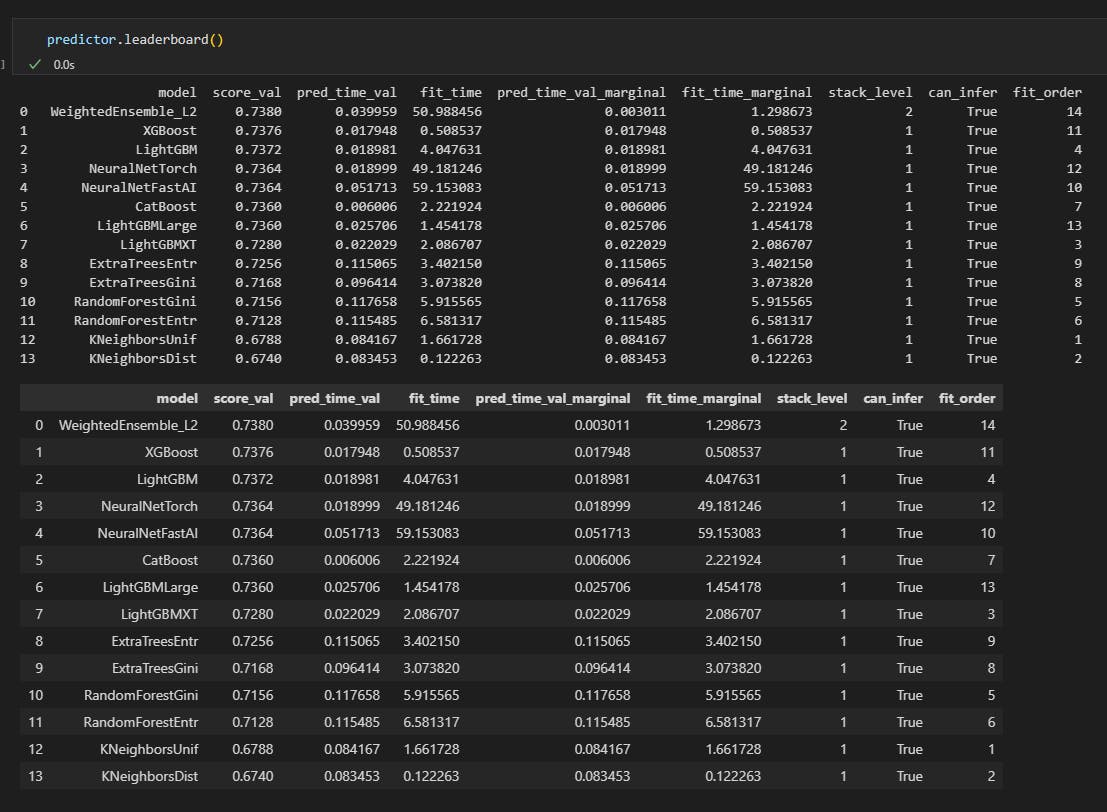
I created a leaderboard to show which of the models is the best
Testing
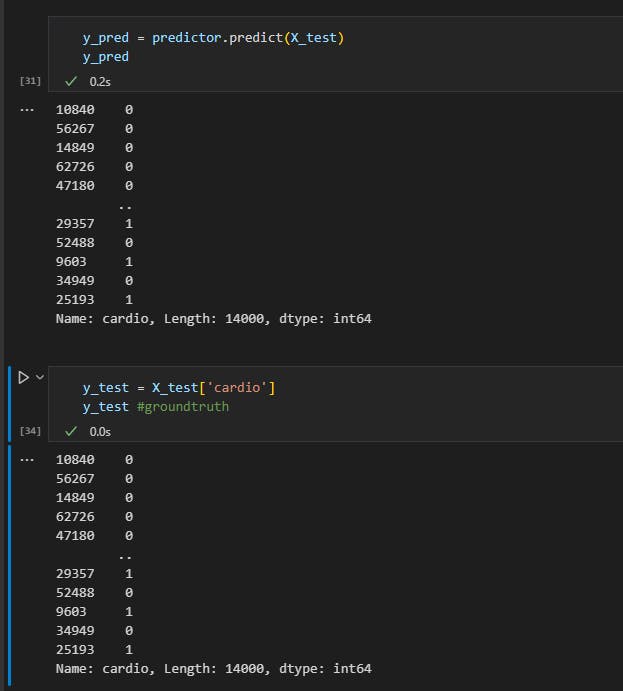
Here I used the 20% of the original data I set aside to generate predictions
then I created a confusion matrix. confusion matrices are used
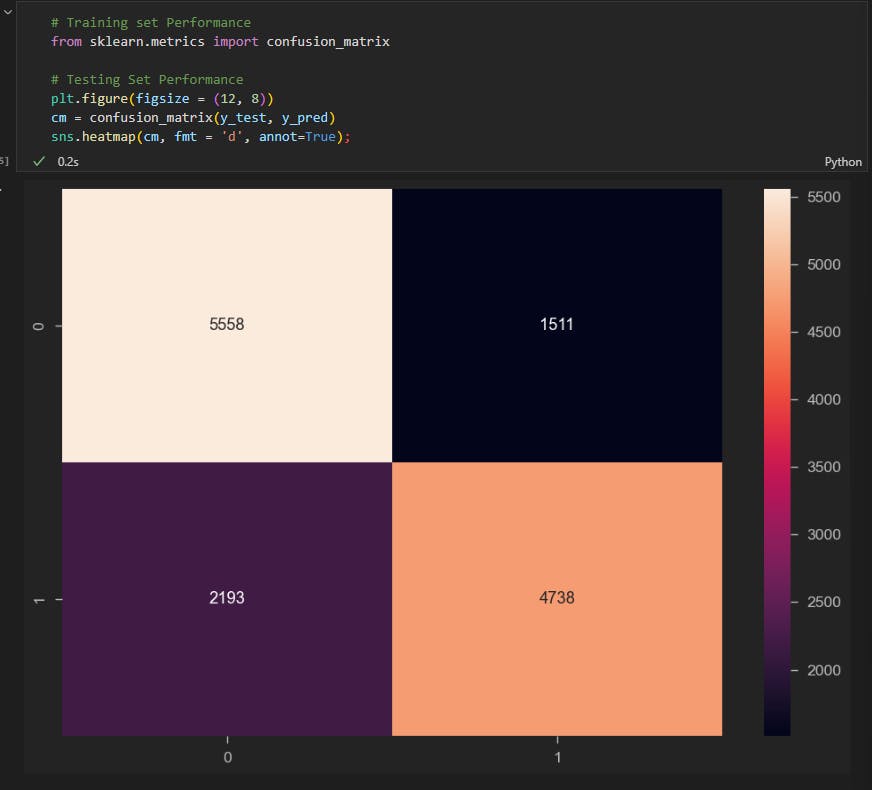
this matrix shows (5558 + 4738) that have been correctly classified and (1511 + 2193) that have been wrongly identified
from this classification report
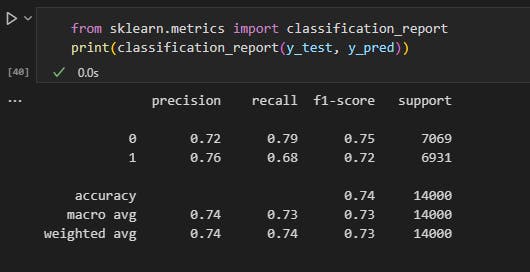
we can see how precise and accurate the model is
Conclusion
From this project, I learned that machine learning can be a powerful tool for predicting heart disease and identifying risk factors. I also gained experience in using the Autogluon library and exploring data using various visualization techniques.
Moving forward, this knowledge can be implemented in several ways. For instance, the models developed in this project could be further refined and optimized using additional data and feature engineering techniques. Additionally, the models could be integrated into a clinical decision support system to assist physicians in making accurate and timely diagnoses of heart disease.
Furthermore, the approach taken in this project could be applied to other health conditions or diseases, such as diabetes or cancer, by modifying the input features and target variable. By using machine learning to identify patterns and risk factors associated with various health conditions, we can develop more targeted and effective prevention and treatment strategies, ultimately improving health outcomes for patients.